Decision trees in python with scikit-learn and pandas
Jun 8, 2015
warning
This post is more than 5 years old. While math doesn't age, code and operating systems do. Please use the code/ideas with caution and expect some issues due to the age of the content. I am keeping these posts up for archival purposes because I still find them useful for reference, even when they are out of date!
In this post I will cover decision trees (for classification) in python, using scikit-learn and pandas . The emphasis will be on the basics and understanding the resulting decision tree. I will cover:
- Importing a csv file using pandas,
- Using pandas to prep the data for the scikit-learn decision tree code,
- Drawing the tree, and
- Producing pseudocode that represents the tree.
The last two parts will go over what the tree has actually found-- this is one of the really nice parts of a decision tree: the findings can be inspected and we can learn something about the patterns in our data. If this sounds interesting to you, read on. Also, if you have other ideas about how to do related things please leave comments below!
gist
Before we get going, the code is available as a gist, so you don't have to copy and paste (unless you want to). I'll go through the functions and usage from scratch here-- usage of the gist code is detailed there in a README file.
imports
So, first we do some imports, including the
print_function for
python3-style print statements. I also import the usual suspects, using common
abbreviations, which I'll discuss below:
from __future__ import print_function

import os
import subprocess

import pandas as pd
import numpy as np
from sklearn.tree import DecisionTreeClassifier, export_graphviz
data with pandas
Next, we need some data to consider. I'll use the famous iris data set, that has various measurements for a variety of different iris types. I think both pandas and sckit-learn have easy import options for this data, but I'm going to write a function to import from a csv file, using pandas. The point of this process is to demonstrate how pandas can be used with scikit-learn. So, we define a function for getting the iris data:
def get_iris_data():
    """Get the iris data, from local csv or pandas repo."""
    if os.path.exists("iris.csv"):
        print("-- iris.csv found locally")
        df = pd.read_csv("iris.csv", index_col=0)
    else:
        print("-- trying to download from github")
        fn = "https://raw.githubusercontent.com/pydata/pandas/" + \
             "master/pandas/tests/data/iris.csv"
        try:
            df = pd.read_csv(fn)
        except:
            exit("-- Unable to download iris.csv")

        with open("iris.csv", 'w') as f:
            print("-- writing to local iris.csv file")
            df.to_csv(f)

    return df
Notes:
-
This function first tries to read the data locally, using pandas. This is why
I import
osabove to make use of theos.path.exists()method. If the iris.csv file is found in the local directory, pandas is used to read the file usingpd.read_csv()-- note that pandas has been imported usingimport pandas as pd. This is typical usage for the package. -
If a local iris.csv is not found, pandas is
used to grab the data from a url and a local copy is saved for future
runs. A
tryandexceptare used to exit and provide a note if there are problems--maybe the user is not connected to the internet?
Hopefully the above codes gives a sense of how to load a csv data file,
locally as well as from a remote location. The next step is to get the data
and use the head() and
tail() methods to see what the data is
like-- these show the start and end of the dataframe, respectively. So, first
get the data:
df = get_iris_data()producing...
-- iris.csv found locallythen, head and tail:
print("* df.head()", df.head(), sep="\n", end="\n\n")
print("* df.tail()", df.tail(), sep="\n", end="\n\n")
producing...
* df.head()
   SepalLength  SepalWidth  PetalLength  PetalWidth         Name
0          5.1         3.5          1.4         0.2  Iris-setosa
1          4.9         3.0          1.4         0.2  Iris-setosa
2          4.7         3.2          1.3         0.2  Iris-setosa
3          4.6         3.1          1.5         0.2  Iris-setosa
4          5.0         3.6          1.4         0.2  Iris-setosa

* df.tail()
     SepalLength  SepalWidth  PetalLength  PetalWidth            Name
145          6.7         3.0          5.2         2.3  Iris-virginica
146          6.3         2.5          5.0         1.9  Iris-virginica
147          6.5         3.0          5.2         2.0  Iris-virginica
148          6.2         3.4          5.4         2.3  Iris-virginica
149          5.9         3.0          5.1         1.8  Iris-virginica
From this information we can talk about our goal: to predict Name (or, type of iris) given the features SepalLength, SepalWidth, PetalLength and PetalWidth. We can use pandas to show the three iris types:
print("* iris types:", df["Name"].unique(), sep="\n")producing...
* iris types:
['Iris-setosa' 'Iris-versicolor' 'Iris-virginica']
preprocessing
In order to pass this data into scikit-learn we need to encode the Names to integers. To do this we'll write another function and return the modified data frame as well as a list of the target (class) names:
def encode_target(df, target_column):
    """Add column to df with integers for the target.

    Args
    ----
    df -- pandas DataFrame.
    target_column -- column to map to int, producing
                     new Target column.

    Returns
    -------
    df_mod -- modified DataFrame.
    targets -- list of target names.
    """
    df_mod = df.copy()
    targets = df_mod[target_column].unique()
    map_to_int = {name: n for n, name in enumerate(targets)}
    df_mod["Target"] = df_mod[target_column].replace(map_to_int)

    return (df_mod, targets)
Let's see what we have (I'll show just Name and Target columns to prevent wrapping):
df2, targets = encode_target(df, "Name")
print("* df2.head()", df2[["Target", "Name"]].head(),
      sep="\n", end="\n\n")
print("* df2.tail()", df2[["Target", "Name"]].tail(),
      sep="\n", end="\n\n")
print("* targets", targets, sep="\n", end="\n\n")
producing...
* df2.head()
   Target         Name
0       0  Iris-setosa
1       0  Iris-setosa
2       0  Iris-setosa
3       0  Iris-setosa
4       0  Iris-setosa

* df2.tail()
     Target            Name
145       2  Iris-virginica
146       2  Iris-virginica
147       2  Iris-virginica
148       2  Iris-virginica
149       2  Iris-virginica

* targets
['Iris-setosa' 'Iris-versicolor' 'Iris-virginica']
Looks good, Iris-setosa has been mapped to zero, Iris-versicolor to one, and Iris-virginica to two. Next, we get the names of the feature columns:
features = list(df2.columns[:4])
print("* features:", features, sep="\n")
producing...
* features:
['SepalLength', 'SepalWidth', 'PetalLength', 'PetalWidth']
fitting the decision tree with scikit-learn
Now we can fit the decision tree, using the
DecisionTreeClassifier
imported above, as follows:
y = df2["Target"]
X = df2[features]
dt = DecisionTreeClassifier(min_samples_split=20, random_state=99)
dt.fit(X, y)
Notes:
-
We pull the
Xandydata from the pandas dataframe using simple indexing. -
The decision tree, imported at the start of the post, is initialized with
two parameters:
min_samples_split=20requires 20 samples in a node for it to be split (this will make more sense when we see the result) andrandom_state=99to seed the random number generator.
visualizing the tree
We can produce a graphic using the following function (graphviz is not part of python/scikit-learn and this only works if graphviz is installed on your system-- if not, check the site and see if you can install):
def visualize_tree(tree, feature_names):
    """Create tree png using graphviz.

    Args
    ----
    tree -- scikit-learn DecsisionTree.
    feature_names -- list of feature names.
    """
    with open("dt.dot", 'w') as f:
        export_graphviz(tree, out_file=f,
                        feature_names=feature_names)

    command = ["dot", "-Tpng", "dt.dot", "-o", "dt.png"]
    try:
        subprocess.check_call(command)
    except:
        exit("Could not run dot, ie graphviz, to "
             "produce visualization")
Notes:
-
The
export_graphvizmethod, imported from scikit-learn above, writes a dot file. This file is used to produce the graphic. -
subprocess, imported above, is used to process the dot file and generate the graphic dt.png-- see the example below. If this does not work, most likely you have not installed graphviz (see above).
So, running the function:
visualize_tree(dt, features)results in
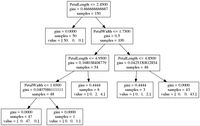
Okay, what does this all mean? Well, we can use this figure to understand the patterns found by the decision tree:
- Imagine that all data (all rows) start in a single bin at the top of the tree.
- All features are considered to see how the data can be split in the most informative way-- this uses the gini measure by default, but this can be changed to entropy if you prefer; see {% sbUrl refs["decision tree classifier documentation"] %}.
- At the top we see the most informative condition is PetalLength ≤ 2.4500 . If this condition is true, take the left branch to get to the 50 samples of value = [50. 0. 0.]. This means there are 50 examples of class/target 0, in this case Iris-setosa. Unfortunately, the default scikit-learn export to graphviz/dot does not seem to be able to include this information (but see below). The other 100 samples, of the 150 total, go to the right bin.
-
This splitting continues until
- The split creates a bin with only one class-- for example the bin with 50 Iris-setosa is not split again.
-
Or, the resulting bin has less than 20 samples-- this is because we set
the
min_samples_split=20when initializing the decision tree. If we had not set this value, the tree would keep splitting until all bins have a single class.
So, that's it for the visualization-- you should be able to trace, from top to bottom, and see how the rules discussed above were applied to the iris data.
psuedocode for the decision tree
Finally let's consider generation of psuedocode that represents the learned decision tree. In particular, the target names (classes) and feature names should be included in the output so that it is simple to follow the patterns found. The function below is based on the answer to a stackoverflow question . I've made some additions to the function to meet the requirements I've stated above:
- The target names can be passed to the function and are included in the output. The output now shows both the features used for branching conditions as well as the class, or classes, found in the resulting node/bin.
-
The if / else structure has indenting, using the
spacer_baseargument to make the output easier to read (I think).
That said, the function is:
def get_code(tree, feature_names, target_names,
             spacer_base="    "):
    """Produce psuedo-code for decision tree.

    Args
    ----
    tree -- scikit-leant DescisionTree.
    feature_names -- list of feature names.
    target_names -- list of target (class) names.
    spacer_base -- used for spacing code (default: "    ").

    Notes
    -----
    based on http://stackoverflow.com/a/30104792.
    """
    left      = tree.tree_.children_left
    right     = tree.tree_.children_right
    threshold = tree.tree_.threshold
    features  = [feature_names[i] for i in tree.tree_.feature]
    value = tree.tree_.value

    def recurse(left, right, threshold, features, node, depth):
        spacer = spacer_base * depth
        if (threshold[node] != -2):
            print(spacer + "if ( " + features[node] + " <= " + \
                  str(threshold[node]) + " ) {")
            if left[node] != -1:
                    recurse(left, right, threshold, features,
                            left[node], depth+1)
            print(spacer + "}\n" + spacer +"else {")
            if right[node] != -1:
                    recurse(left, right, threshold, features,
                            right[node], depth+1)
            print(spacer + "}")
        else:
            target = value[node]
            for i, v in zip(np.nonzero(target)[1],
                            target[np.nonzero(target)]):
                target_name = target_names[i]
                target_count = int(v)
                print(spacer + "return " + str(target_name) + \
                      " ( " + str(target_count) + " examples )")

    recurse(left, right, threshold, features, 0, 0)
and the resulting output for application to the iris data is:
get_code(dt, features, targets)producing...
if ( PetalLength <= 2.45000004768 ) {
    return Iris-setosa ( 50 examples )
}
else {
    if ( PetalWidth <= 1.75 ) {
        if ( PetalLength <= 4.94999980927 ) {
            if ( PetalWidth <= 1.65000009537 ) {
                return Iris-versicolor ( 47 examples )
            }
            else {
                return Iris-virginica ( 1 examples )
            }
        }
        else {
            return Iris-versicolor ( 2 examples )
            return Iris-virginica ( 4 examples )
        }
    }
    else {
        if ( PetalLength <= 4.85000038147 ) {
            return Iris-versicolor ( 1 examples )
            return Iris-virginica ( 2 examples )
        }
        else {
            return Iris-virginica ( 43 examples )
        }
    }
}
This should be compared with the graphic output above-- this is just a different representation of the learned decision tree. However, I think the addition of target/classes and features really make this useful.
Okay, that's it for this post. There are many topics I have not covered, but I think that I've provided some useful code for understanding a decision tree learned with scikit-learn. Useful links at the scikit-learn site, to dig deeper include:
- decision tree classifier example -- a simple decision tree example.
- decision tree classifier documentation -- documentation for the class. Be sure to check out the many parameters that can be set.
- decision tree classifier plot boundaries -- how to plot the decision boundaries for the iris data. Unfortunately, they normalize the data before training and plotting, resulting in negative lengths, which are very difficult to relate back to the original data.
Importantly, I have not covered how to set parameters and to avoid over fitting. However, that's beyond the scope of this post. The best place to start for this is the cross-validation tools in scikit-learn. Check out:
- scikit-learn cross-validation -- there's even an example with the iris data to get you started!
- scikit-learn grid search -- search through set of parameters to find the best setting(s).
As always, post comments and questions below. Corrections and typos are also welcomed!